Can we use fish scales to identify spring and autumn spawning herring (Clupea harengus)?
1. Introduction
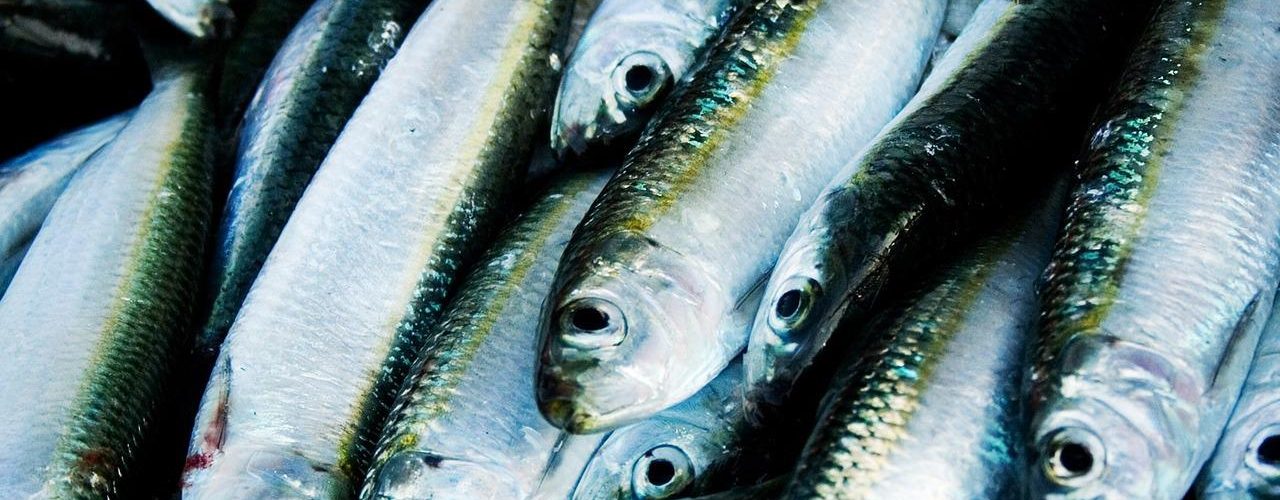
Norwegian spring-spawning (NSS) herring (Clupea harengus) represents one of the world’s most abundant fish stocks and is of great commercial importance for many nations (Bjørndal & Gordon, 2000). The NSS stock size have fluctuated throughout the 20th century. Heavy fishing pressure and environmental influence on recruitment caused declines in the 50s and 60s while recruitment from strong year classes and less commercial exploitation caused a slow increase over the later decades (Nakken et al., 2008; Toresen & Østvedt, 2000). Variation in features among individuals leads to a more resilient population, with a higher chance of survival when exposed to challenges like overfishing or changes in the environment (Markert et al., 2010). To avoid stock collapses in the future, fisheries management aim to maintain diversity of populations, using stock assessments (Smedbol & Stephenson, 2001). Correct population identification and discrimination are essential to perform reliable stock assessments, and therefore it is important to study behavior, life history, genetic differentiation, and morphology (Begg et al., 1999).
Spawning seasonality is an important factor in stock assessment because fish stocks are especially vulnerable to commercial exploitation during their spawning season (Biggs et al., 2021). NSS herring aggregate when spawning, which make them easier to catch in bigger numbers (Erisman et al., 2017; Slotte, 1998). Herring is specifically known for their phenotypic plasticity when it comes to spawning season (Geffen, 2009). Herring usually spawns in autumn (autumn spawning herring) or spring (spring spawning herring), but spawning can be observed at different times throughout the year (Sinclair & Tremblay, 1984). Metamorphosis in Atlantic herring is a process that takes place gradually over weeks, and body size at completion may vary (Sinclair & Tremblay, 1984). Because autumn spawned herring overwinters their first winter and have a longer growth season the following year, they can begin metamorphosis earlier than the spring spawned individuals. There are several methods that are used to identify autumn and spring spawning herring including use of genetic markers, checking maturity development, and analysis of otolith microstructure (Berg et al., 2021). Berg’s comparison of the different methods showed that the otolith-typing contradicted the other two methods in 7% of the cases while phenotypical assignment was contradictory 8 % of the time. In the case where the results of the methods contradict each other, it is important to have other methods for differentiating spawning groups. Fish scales are used to identify species and estimate growth and could potentially be used to differentiate between autumn and spring spawning herring since their growth period differs (Bräger et al., 2017; Poulet et al., 2005).
The form of herring scales is almost elliptic, with the size and shape varying between individuals. Herring scales have a median that separate the different sides of the scale. One of the sides is almost transparent, while the other show annual rings describing age and growth patterns of the fish. The side with the annual rings alternates between narrow transparent rings representing physiological winter, and broader less-transparent areas representing physiological summer (Dahl, 1907). A schematic drawing of a herring scale showing the annual growth rings is shown in Fig 1.
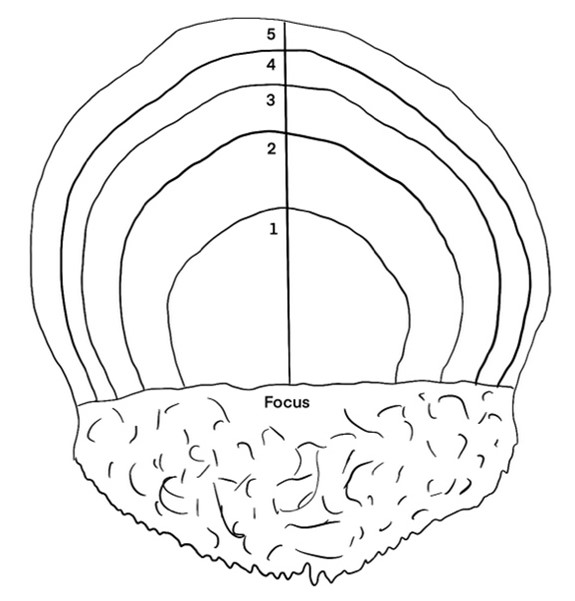
Figure 1: Schematic drawing of a herring scale.
Our aim for this report was to investigate if we can use herring scales to distinguish between autumn and spring spawning herring. Our hypothesis was that herring that is genetically fit for autumn spawning (genetic autumn spawners) have a relatively wider first scale increment size than genetic spring spawners, due to longer first growth season. We further hypothesize that this difference could be used to differentiate between the two spawning groups.
2. Method
2.1. Biological data
160 herring were taken from a series of gill net samples at Herdla, Askøy at varying times of the year in the time period from 31.10.2016 to 18.09.2018 (Table 1). The fish were measured (total length (mm), total weight (g)), and otoliths, scales and DNA samples were taken for further analyses. The otoliths were used to determine age and spawning time, while the genetic samples were used to determine genetic spawning season.
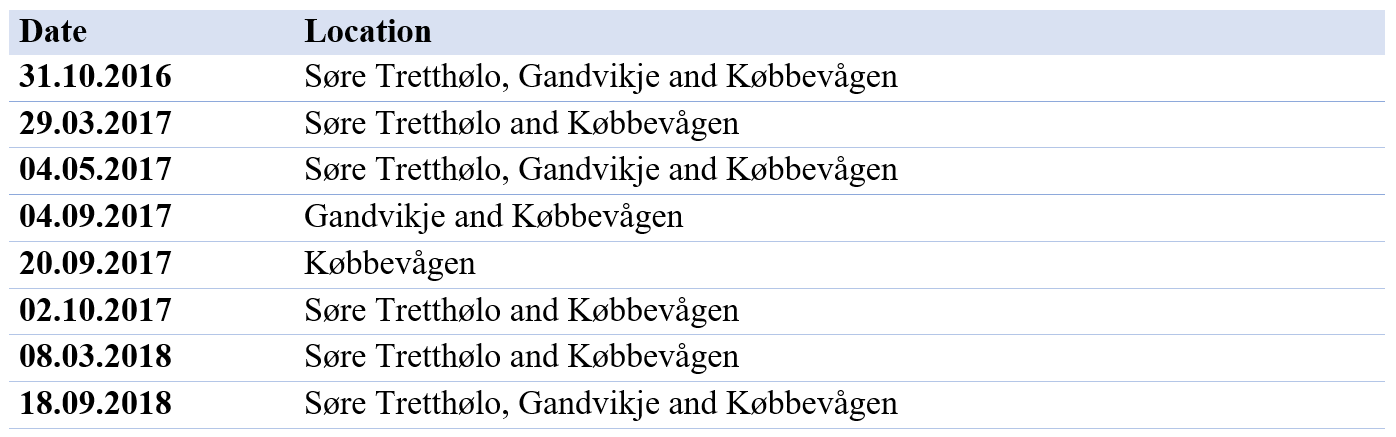
Table 1: Overview of dates and locations of trawls where the Atlantic herring (Clupea harengus) were captured.
The genetic analysis of the DNA identified the genotype at two genetic markers, indicating the spawning season the individuals were fit for. Individuals were identified as Autumn, HeteroAutumn, Spring, HeteroSpring or Heterozygote genetic spawners (Table 2). In this study, the herring were further divided into two genetic groups; Genetic Autumn Spawners and Genetic Spring Spawners. Genetic Autumn Spawners included Autumn and HeteroAutumn individuals, while Genetic Spring Spawners included Spring and HeteroSpring individuals. Heterozygote spawners were excluded from the statistical analysis because we could not divide these individuals into genetic spring and autumn spawners.
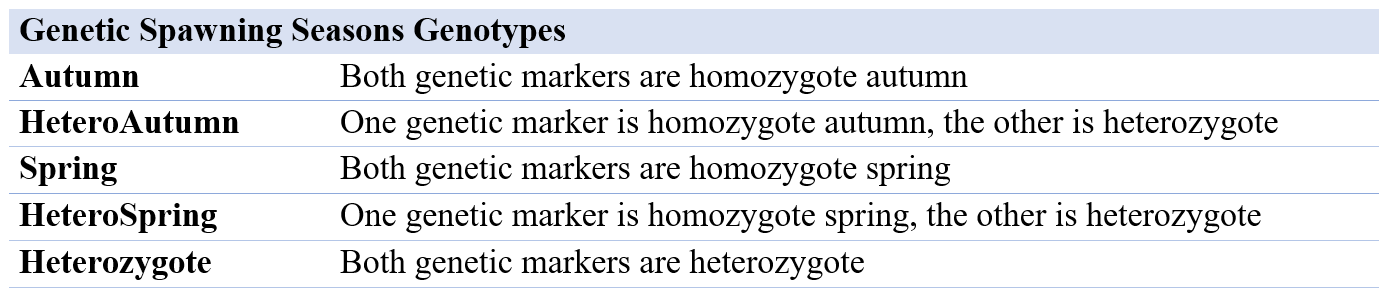
Table 2: Table of genetic spawning season genotypes, using the genotype composition of two genetic markers indicating genetic spawning season.
Analysis of the otoliths were performed to identify spawning phenotype as well as age. Otolith age was compared to age determined from the scales, while otolith spawning season was used to see whether there were any differences in the scales of autumn and spring spawned herring.
The herring scales were mainly collected from an area dorsally above the lateral line but could also be collected from other areas of the fish body if few remained attached in the original area.
2.2. Scale analysis
The fish scales were placed in NUNC trays covered with water and frozen. When the analyses were performed, the scales were thawed and the fatty surface skin was removed by placing the scale between index finger and thumb, rubbing the layer off. The scales were again dipped in water before being placed on top of a slide covered in a gelatin coating to keep the scales in place. The gelatin coating was made by mixing 5 grams of gelatin (Merck Emprove catalogue number: 1.04078.1000. CAS # 9000-70-8) with 2,5 dl water and heating it up. The gelatin coating was smeared on to the slides and set to dry for 24 hours in room temperature.
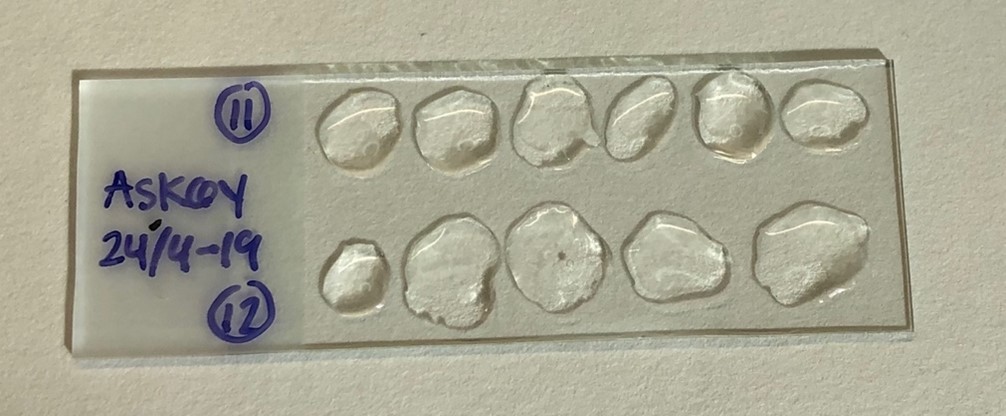
Figure 2 : Picture of a slide with gelatin coating. Each slide had scales from 2 individuals with at least 5 scales from each fish. The fatty skin layer is removed from the scales before they are placed on the slide.
3 or more scales from each fish were placed on a slide for comparison purposes and to ensure that at least one scale was readable (Figure 2). After the herring scales were mounted, a stereo microscope (Leica M125) in 1x enlargement and a camera (Nikon Digital Sight DS-U3) was used to take pictures of the scales. The scale with the best quality and easiest read was chosen for each individual. A picture was taken of a calibration scale for use in later measurements of annual ring lengths. The data program ImageJ(1.53a) was used in the length analyses of the scales. The scale was set to 10mm, using the calibration picture that was taken along with the pictures of the herring scales. A reference line going from the middle of the focus and straight up through the scale was drawn on every picture. Every annual ring was then marked by a point and the x- and y-values were noted down using the measure feature in ImageJ. These values were then added to an Excel file where the radius and increments were calculated.
All fish caught on the northern hemisphere have January 1st registered as their birthday. Because the annual rings of the scale grow throughout the year, a fish caught in August will have a larger outer annulus than a fish caught in April. The outer edge of the scale from a fish caught from January to May will be counted as a year annulus while it will not be counted for individuals caught from June to December (Figure 3). Radius and increment are indicated in the schematic drawing in Figure 3. Both radius 1 and increment 1 is measured vertical from the horizontal focus line, up to the end of the first annual winter ring. Increment 2 is measured from the end of Increment 1 and up to the end of the second annual winter rind, while radius 2 is measured from the horizontal line at the focus up to the end of the second annual winter ring.
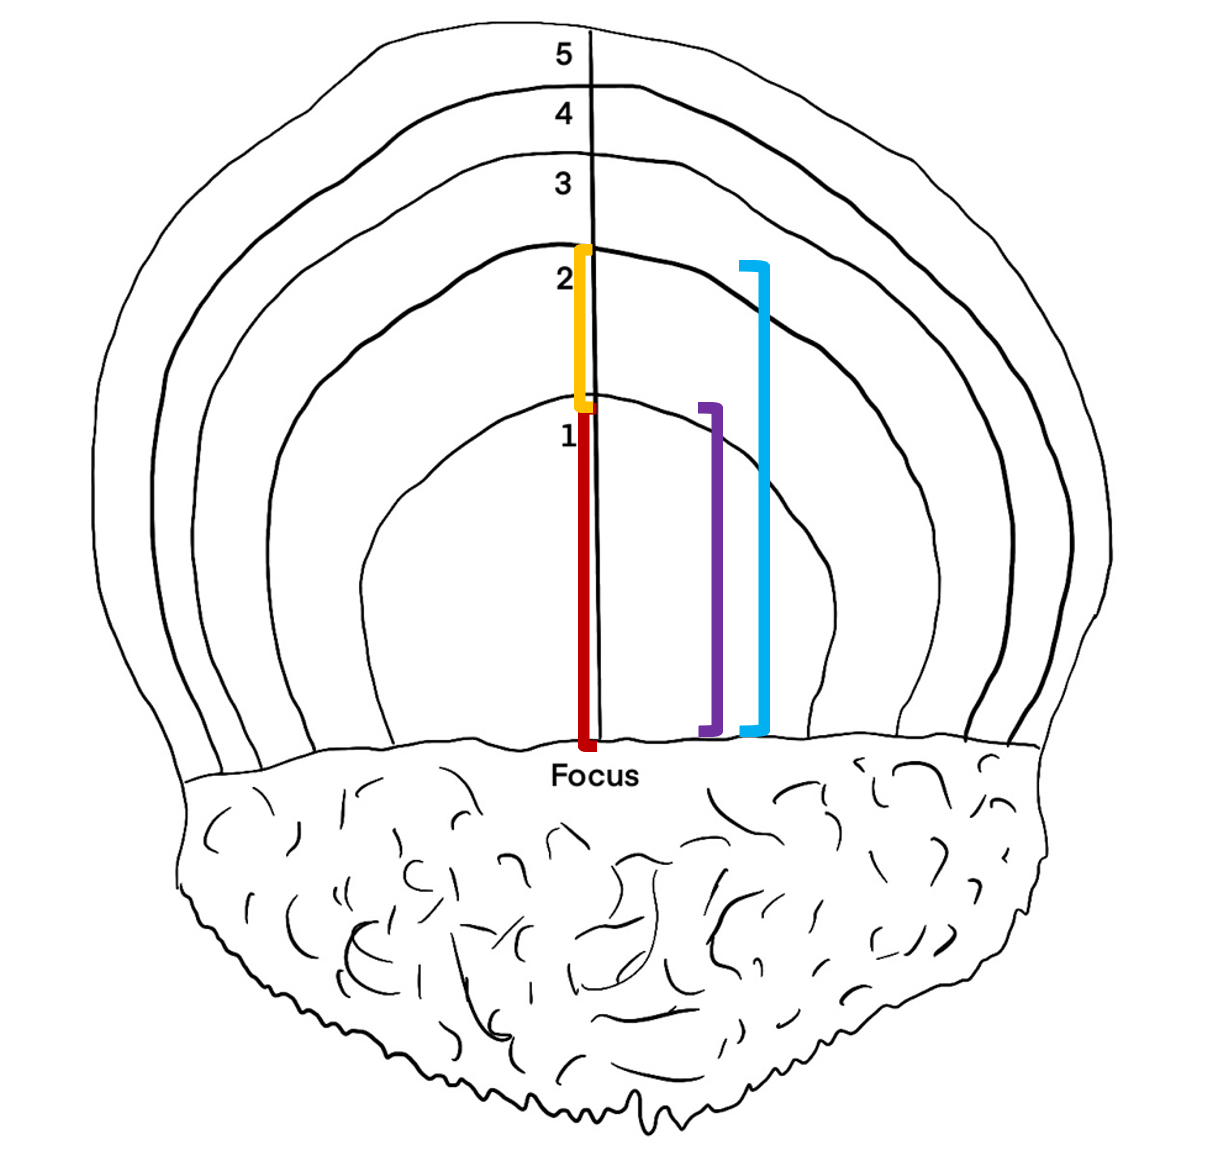
Figure 3: Schematic drawing of a herring scale. All fish caught on the northern hemisphere have January 1st registered as their birthday. Because the annual rings of the scale grow throughout the year, a fish caught in August will have a larger outer annulus than a fish caught in April. The outer edge of the scale from a fish caught from January to May will be counted as a year annulus while it will not be counted for individuals caught from June to December. Line used for measurement of growth increments with age corresponding annuli indicated. The different colored lines indicate the measurements of increment 1 (red line), increment 2 (yellow line), radius 1 (purple line) and radius 2 (blue line).
2.3. Statistical analysis
One-way ANOVA tests were performed to compare the different spawning and genetic groups using the R software (Team, 2013). All statistical analysis were performed with a significance level of 0.05.
For statistical analyses, we used scatter plots to get a visual indication on the influence of genetic spawning season on the relationship between otolith age and fish length as well as the relationship between fish length and scale length. We used pivot tables and means plots to look at how genetic spawning season affected radius 1, radius 2, and the relationship between radius 1 and radius 2. The same pivot table and means plot were performed with increment 1, increment 2, and the relationship between increment 1 and increment 2.
3. Results
Fish length in relation to otolith age varied slightly with genetic spawning groups (Figure 4). The two genetic spawning groups start out at the same length of 30 cm, at 2 years of age. Genetic spring spawners grow longer than genetic autumn spawners on average as they get older. The genetic autumn spawners have extreme outliers both on the positive and negative sides of the regression line.
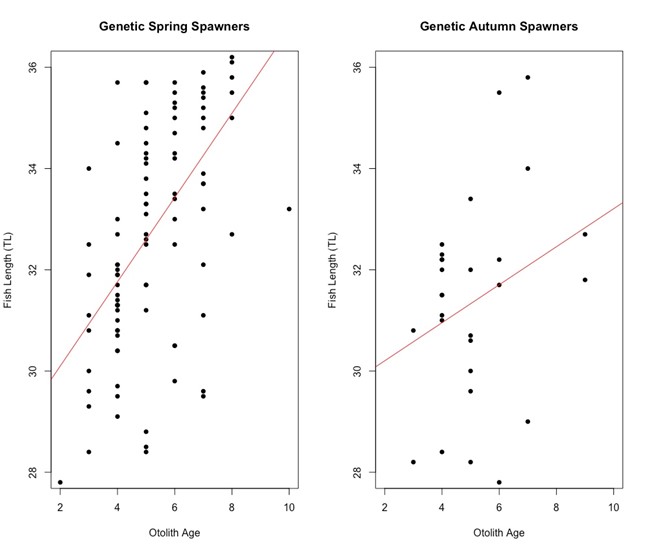
Figure 4: Scatter plot of otolith age against fish length (cm) for the two genetic spawning groups. From the plot we can see that there is a difference between the two genetic spawning groups when we look at the length of fish and their age. The linear model equation for genetic spring spawners is y = 28.4329 + 0.8323x and the linear model equation for genetic autumn spawners is y = 29.4508 + 0.3755x. At around age 2 both groups are approximately 30 cm long, and the genetic spring spawners tend to get longer as they grow older that the genetic autumn spawners. The genetic autumn spawners have extreme outliers both on the positive and negative side.
There was no apparent difference between the two genetic spawning groups in the relationship between fish length and scale length (Figure 5). Both genetic spring and genetic autumn spawning herring started out at around 4.5 μm at 28 cm, going up to 5.5 – 6 μm at 36 cm for otolith length and fish length, respectively.
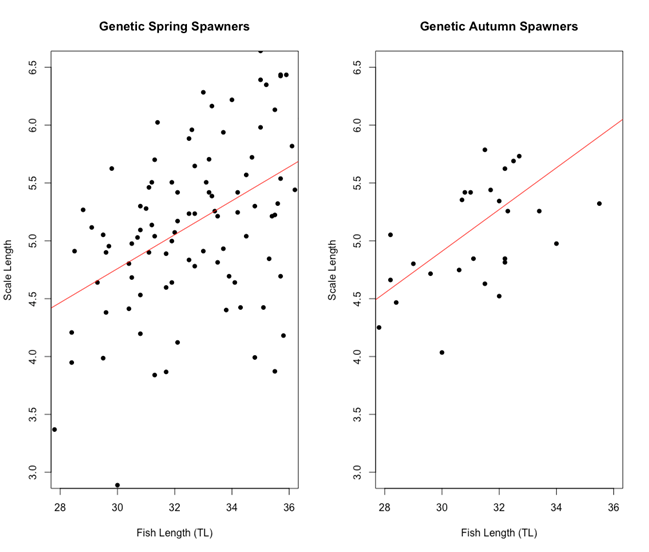
Figure 5: Scatter plot of fish length (cm) vs Scale length (μm) for each of the genetic spawning groups. The linear model equation for genetic spring spawners is y = 0.3603 + 0.1466x and the linear model equation for genetic autumn spawners is y = -0.5052 + 0.1805x. There are no significant differences between the two genetic spawning groups when it comes to the relationship between scale length and fish length.
There was a small difference in mean of radius 1 and 2 between the autumn and spring spawned individuals that spawned in their genetic spawning season (Table 3, Figure 6). There was a bigger difference in radius 1 and 2 between the groups where individuals had the same spawning season genotype and phenotype, and in the groups where spawning season phenotype and genotype did not match. The same differences were found when we looked at the relationship between radius 1 and 2 by division.
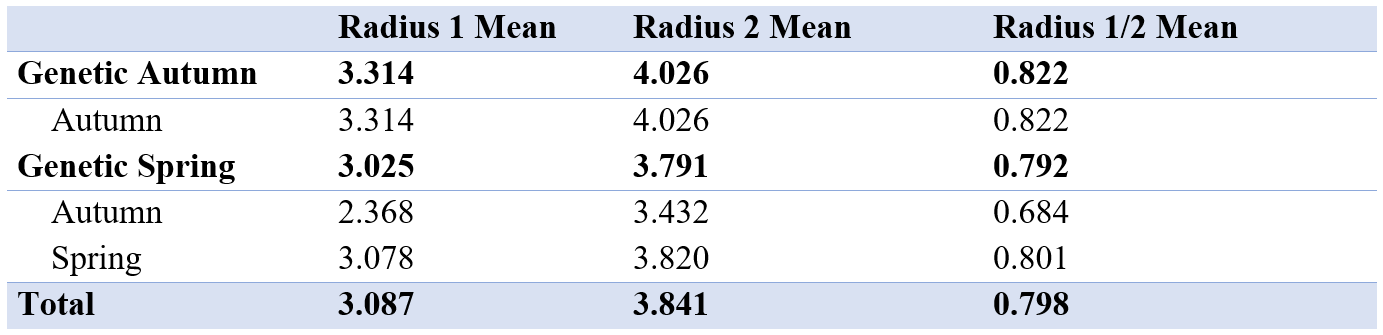
Table 3: Table showing mean of first and second radius and mean of radius 1 divided by radius 2 for all genetic spawning groups. The different groups seem to be similar, with no significant differences. The measurements are in μm.
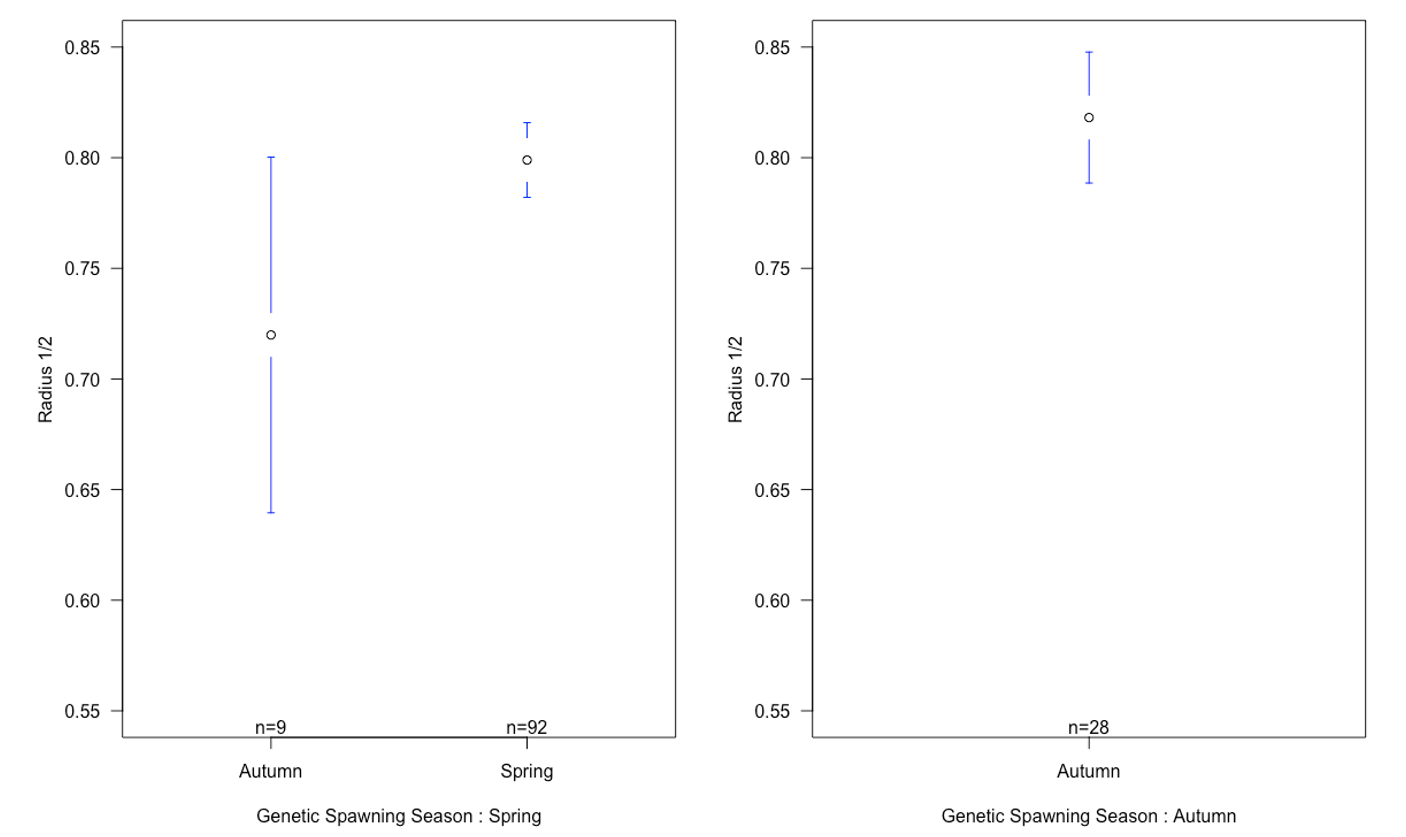
Figure 6: Means plot of relationship between the mean of radius 1 and 2 with standard deviation for each otolith spawning group, categorized by genetic spawning groups. There is no apparent difference in the relationship between radius 1 and 2 in genetic spring spawners spawned in spring and genetic autumn spawners spawned in autumn. What we can see, is a difference between individuals that are spawned in the season they are genetically fit for, and the individuals that are spawned in the opposite season of the one they are fit for.
The mean of increment 1 and 2 was between the autumn and spring spawned individuals that spawned in their genetic spawning season (Table 4, Figure 7). There was also a difference in increment 1 and 2 between the groups where individuals had the same spawning season genotype and phenotype, and in the groups where spawning season phenotype and genotype did not match. There also were differences in the relationship between increment 1 and 2 by division.
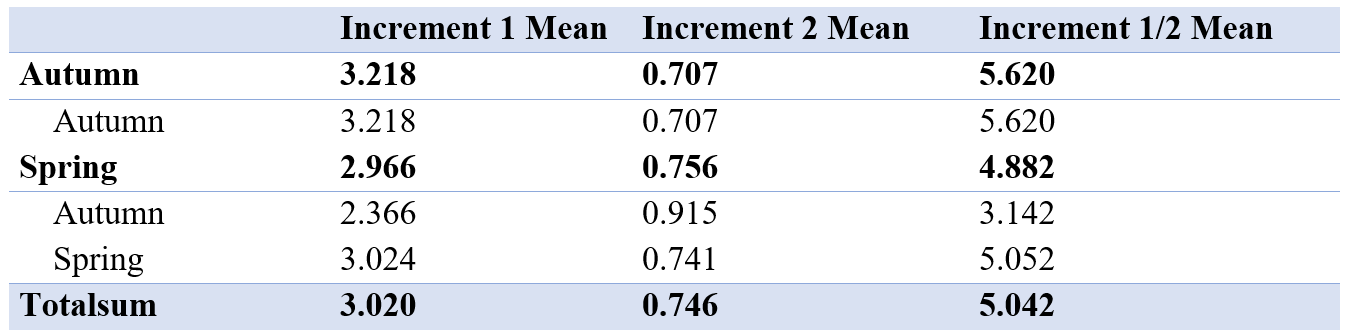
Table 4: Table showing mean of first and second increment and mean of increment 1 divided by increment 2 for all genetic spawning groups. The different groups seem to be similar, with no significant differences
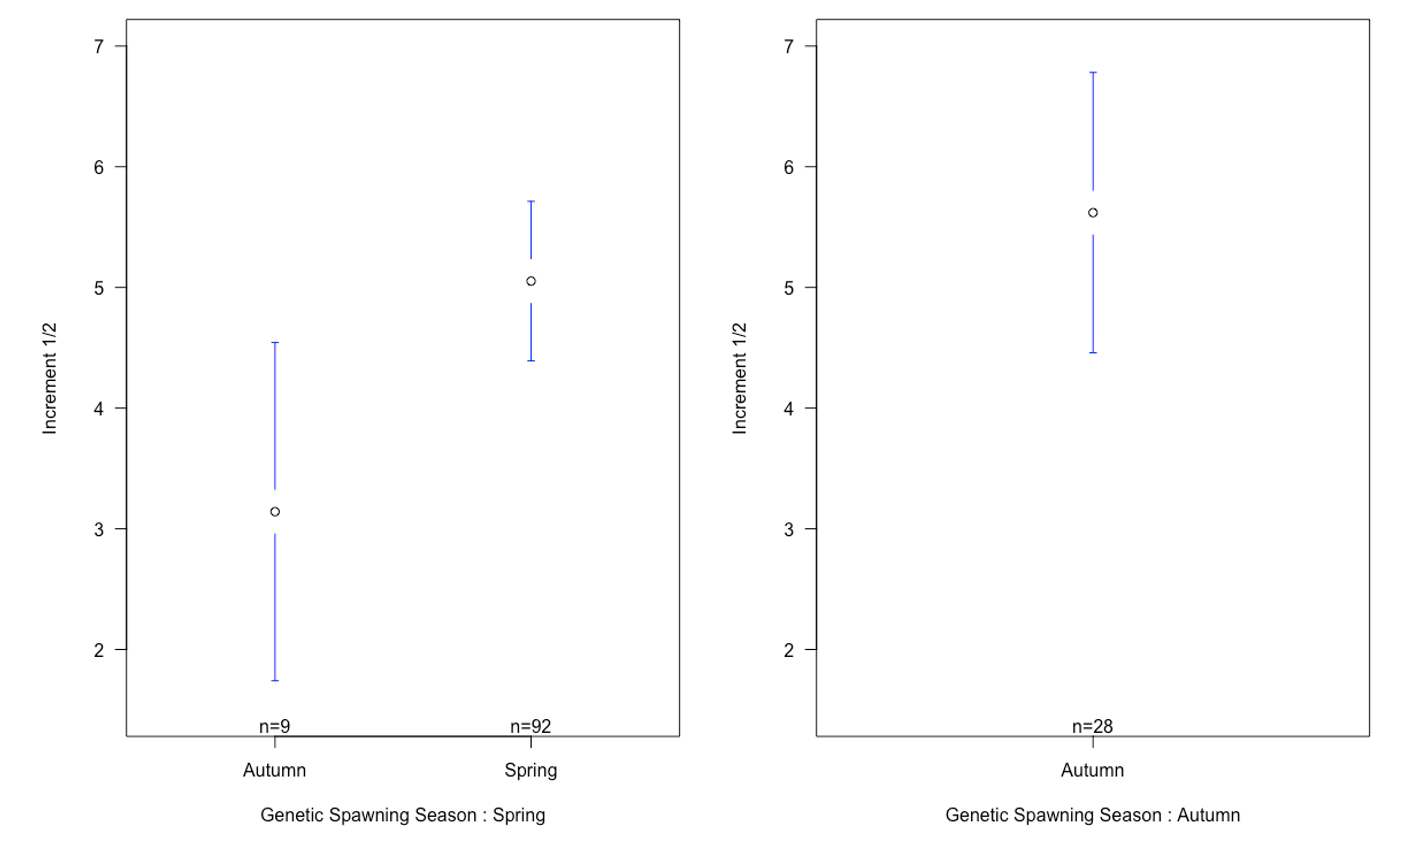
Figure 7: Means plot of relationship between the mean of increment 1 and 2 with standard deviation for each otolith spawning group, categorized by genetic spawning groups. There is no apparent difference in the relationship between increment 1 and 2 in genetic spring spawners spawned in spring and genetic autumn spawners spawned in autumn. What we can see, is a difference between individuals that are spawned in the season they are genetically fit for, and the individuals that are spawned in the opposite season of the one they are fit for.
About the author
Photo: Hannah Røkke
Jeg er 24, snart 25 år gammel og kommer fra Nittedal. Jeg går andre semester på en master i fiskeribiologi og forvaltning, og skal skrive master om genotype avhengig vekst og seleksjon i sildelarver ved forskjellige temperaturer og lysregimer.
Denne teksten er utarbeidet fra rapporten jeg skrev i BIO299 prosjektet mitt i siste semester av bachelorgraden min. Jeg snakket med veilederen min om at jeg gjerne ville skrive om noe spennende og lære meg noe nytt, og fikk denne oppgaven. Det gav meg en god mulighet til å drive selvstendig arbeid på labb, og å prøve ut om denne typen arbeid passer meg.