Particulate element composition and phytoplankton biomass in Puddefjorden and Store Lungegårdsvannet during spring 2021
2. Study site
PUD is located in the northern part of the Byfjorden water body, which is 3.5 kilometers long, and stretches from the tip of the Nordnes peninsula to the SLVbay (Figure 1). The north-eastern part of PUD is characterized by intense port activity with large commercial vessels, while the inner part is characterized by smaller boats and marinas. Additionally, metal pipelines extend underwater across the seabed. In 2015 a risk assessment of the Puddefjorden seabed concluded that there are concerning levels of mercury pollution associated with the accumulation of pollutants in marine biota. This can pose a severe threat to human health mainly by uptake through seafood consumption (Bergen_Kommune, 2020). In 2018, in the inner part of PUD, a new seabed was overlayed with 45 cm of pure tunnel boring machine masses. Covering the contaminated seabed will, in the long run, act as a physical barrier and will insulate the underlying contaminated sediment. This action is part of the project Cleaner Harbor Bergen which aims to alleviate the urban coastal sites of Bergen Harbor from chronic pollution by organic pollutants and heavy metals so as to limit the content of environmental toxins in fish and seafood from Byfjorden as well as make the area safe for leisure activities (Bergen_Kommune, 2020).
SLV(Figure 1) is also one of the sub-areas in the Cleaner Harbor Bergen project, where it is planned to implement measures to monitor the seabed heavy metal pollution in 2022. It has a maximum depth of 26 m and is situated at the southeast end of PUD. The site has a long history as an industrial area, including milling in the Middle Ages, rapid urban and industrial development along the shore, increased shipping activity (Andersson et al., 2014), road traffic, old paint, and other façade materials (Bergen_Kommune, 2020). The water mass of SLV has been dramatically modified over the last 150 years due to continuous land fillings associated with rapid urban development, with the most remarkable one in 1926, when the strait between Lille Lungegårdsvann and SLV was completely filled (Andersson et al., 2014). Today, the connection between SLV and PUD is approximately 3.7 m deep. There is a daily water mass exchange between PUD and SLV during the high and the low tides. As a result of the shallow connection, water exchange is limited, and oxygen in the deepest parts of SLV is depleted (Bergen_Kommune, 2020). The Møllendal River originating from the Svartediket reservoir is SLV’s primary freshwater source. The flow is generally low but can increase significantly after heavy rainfall (Paetzel & Schrader, 2003) which enhances the input of natural minerals in the water.

Figure 1. Overview of the study area with the two stations marked on the map, one in front of the Marineholmen Forskningspark in PUD (total depth 5m) and one in the Møllendal swimming platform in SLV (total depth 11m).
3. Materials and methods
3.1. Sampling and laboratory analysis
This study was carried out weekly in SLV and PUD from the 26th of February to the 28th of April 2021. Five liters of water samples were collected from each station using a Niskin water sampler at 5 m depth in SLV and 3 m depth in PUD (Figure 1). The water samples were analyzed to measure the chlorophyll a concentration and the particulate elemental composition.
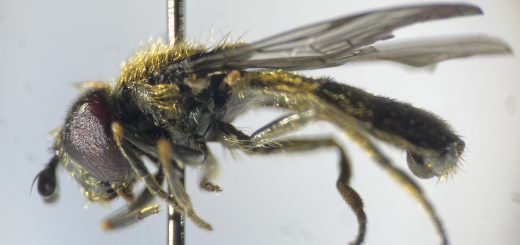
The salinity was recorded using a Xindacheng ATC handheld refractometer. Phytoplankton was identified using a Zeiss Supra 55VP scanning electron microscope after filtering 250 ml of sample material on 1 μm pore size PC filters (25mm diameter). The chlorophyll a concentration was determined according to Parsons et al. (1984) and Holm-Hansen and Riemann (1978). For each station, three replicates were obtained by filtering 250 ml of sample water onto 0.2 μm Nucleopore polycarbonate filters (PC) (47 mm diameter) using moderate vacuum pressure (≤200 mmHg). The day before the analysis, 10 ml of 100% methanol were added to the samples for chlorophyll-a extraction (for 15-24 hours at ~4°C). The fluorescence was measured with a Turner Designs Fluorometer 10-AU. The whole process took place away from external light sources as far as it was possible. The concentration of chlorophyll-a was calculated according to Equation 1.

Equation 1. Formula for calculation of chlorophyll-a concentration (Holm-Hansen and Riemann 1978; Parsons et al. 1984)
Water samples for total particulate element analysis were filtered in triplicate (n=3) on 0.6 μm pore size polycarbonate (PC) filters (47 mm diameter), and Whatman glass fiber (GF) filters (57 mm diameter), using ≤200 mmHg vacuum pressure. After filtration, the filters were rinsed with 5 ml of distilled water to prevent interference from salt crystals and left to air-dry until analysis. Total particulate element concentration was measured by wavelength dispersive X-Ray fluorescence spectroscopy (WDXRF) in a Bruker AXE S4 pioneer XRF instrument, based on the method described by Paulino et al. (2013). Data for S, Na, Mg, Cl, K, Ca, Si, Al, Fe, Cu, and Mn were collected from polycarbonate filters, while data on C, N, and P were taken on three dates (10th of March, 31st of March and 21st of April) from GF filters to avoid interference from the filter’s chemical composition. The concentration of all the above-mentioned chemical elements was calculated by Equation 2 and based on the calibration parameters and detection limits explained in Paulino et al. (2013). For Hg, As, and Pb, information about their relative concentrations were recorded manually by looking at the intensity counts (kilo counts per second – kcps) of the K electron shell for Hg and As and the L electron shell for Pb. The criteria chosen for the analysis was the Highest Resolution (HR) which selects the spectral line that favors the best resolution at the expense of intensity. For both methods, at least three blank filters were analyzed for reference. The instrument measures the total amount of an element and does not discern between different chemical forms.
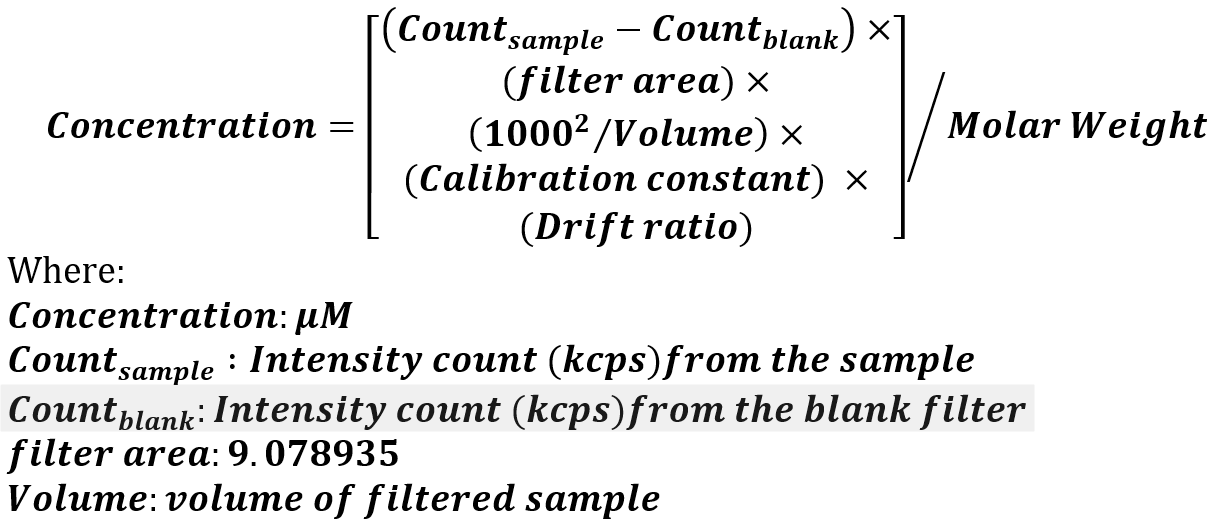
Equation 2. Formula and parameters used for the calculation of the particulate element concentration with WDXRF spectroscopy (Paulino et al. 2013).
3.2. Statistical analysis
A two-sample t-test was applied to compare the mean concentrations of elements between the two sites. Additionally, the results were analyzed for significant changes in the measurements within each site and between sampling dates, using a two-way analysis of variance (two-way ANOVA). The response variables were the measured concentrations of elements and chlorophyll a, and the predictors were the date and station. Whenever the interaction term was not significant, a backward elimination technique was used to remove those features that did not significantly affect the dependent variable (p > 0.05). All statistical analyses and plotting of the data were performed in RStudio using R 4.1.0 (R Core Team, 2017).
4. Results
Throughout the study period, salinity levels varied between 25-33 ‰. From the beginning of March, there was a slight differentiation between the two sites, with SLV having a higher average salinity of 30 in 5 m depth, except for the 24th of March, where salinity reached 33‰ in PUD at 3 m depth. During the second half of the study period, salinity in both areas was on average 27 ‰.
At the beginning of the study, the chlorophyll-a concentration was 1.05 mg/m3 and 0.51 mg/m3 in PUD and SLV, respectively. The maximum chlorophyll a concentrations were measured on the 18th of March in both sites (PUD: 16.46 mg/m3, SLV: 18.83 mg/m3), followed by a dramatic drop on the 24th of March (Figure 2) . Subsequently, the concentration marked an upward trend until the 21st of April. A two-way ANOVA revealed that the variations in chlorophyll a were statistically significant within each area between each date (p 0.05) .

Figure 2. Chlorophyll-a concentration from PUD and SLV during 26th of February – 28th of April 2021.
Particulate C, N, and P average values were 19.76 μM, 2.74 μΜ, 0.35 μΜ in PUD and 22.12 μΜ, 3.69 μΜ, 0.43 μΜ in SLV, respectively. The lowest values in PUD were recorded on the 10th of March, while for SLV on the 31st of March . Generally, C, N, and P concentrations fluctuated in agreement with each other, with N and P remaining relatively stable. On the 31st of March, maximum C:N ratios were recorded in both areas (PUD: 8.88 and SLV: 7.62), which was higher than the Redfield ratio (6.6). The maximum C:P ratios were measured on the 21st of April in both sites (PUD: 59.4 and SLV: 68:85). During the study, average values of C:N, C:P, and N:P ratios were 7.34, 7.3, 53.04 in PUD and 6.32, 8.62, 53.15 in SLV, respectively (Figure 3).
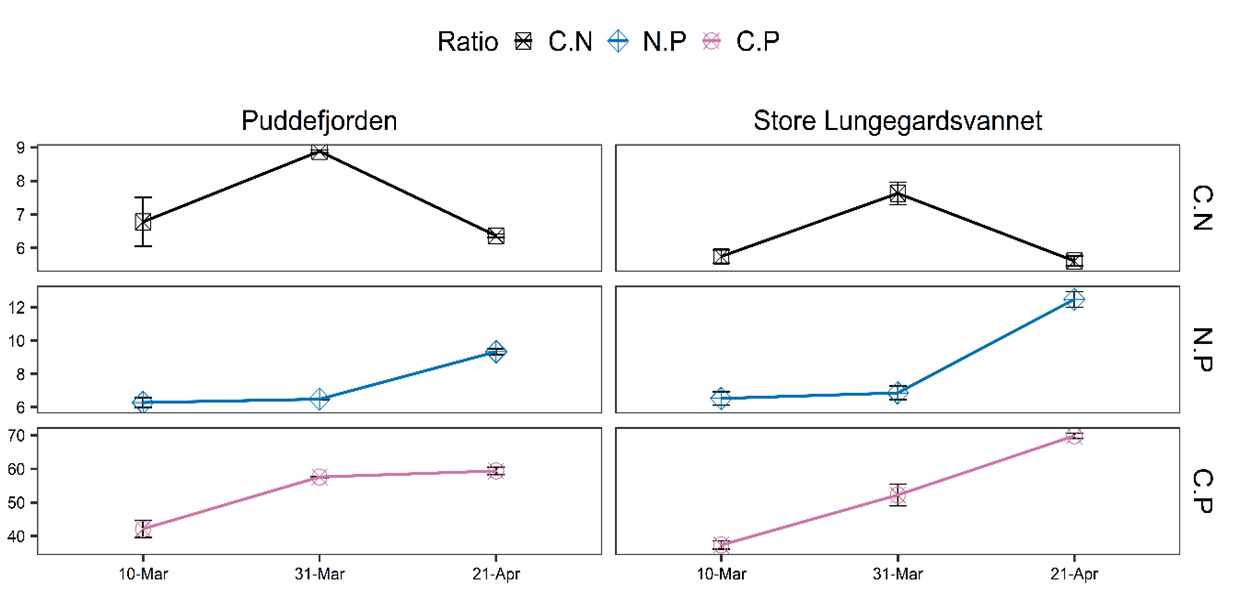
Figure 3. Elemental ratios C:N, N:P and C:P in PUD and SLV during spring 2021.
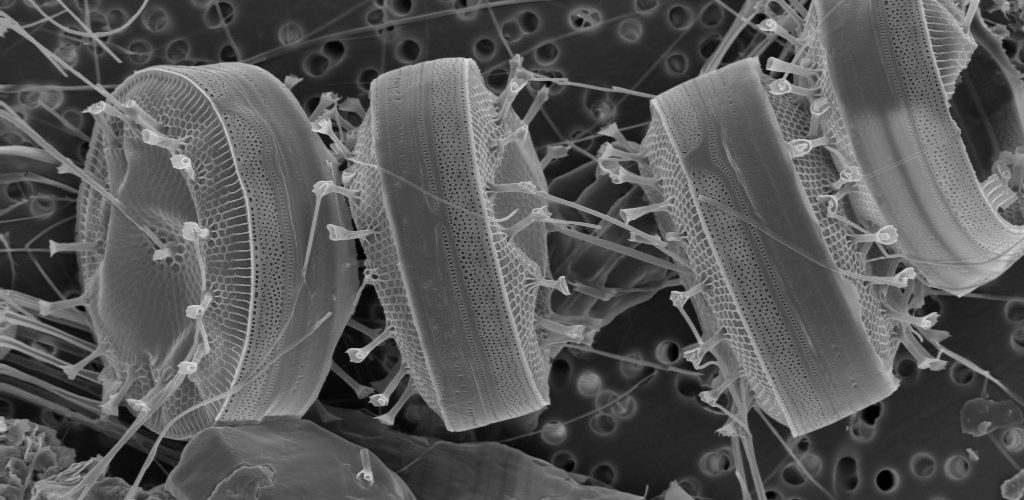
Particulate Ca and Si fluctuated between 0.15-0.95 μM and 0.96–4.57 μM, noting a maximum on the 28th of April and 18th of March, respectively. Particulate Ca varied significantly only between the sampling dates (p < 0.05), while Si was considerably higher in SLV throughout the study (p < 0.05). The maximum particulate Si concentrations observed on the 18th of March coincided with a bloom of the diatom Skeletonema marinoi. S concentration was generally higher in SLV (p = 0.05) but remained low throughout the study. Fe concentration during the first three weeks and the last two weeks of the investigation varied between 0.19 -0.74 mM in both locations but marked a maximum of 3.74 on the 31st of March in SLV. Particulate K and Mg remained at low concentrations and peaked during the second half of the study period but differed significantly between the two areas and between each sampling date (p < 0.05). Maximum K and Mg values reached 0.47 μM in SLV on the 28th of April and 0.64 μΜ in PUD on the 31st of March, respectively (Figure 4).
The particulate concentration of Cu and Mn 0.002-0.004 μΜ and 0.007-0.281 μΜ (Table 1). However, there was no significant fluctuation found or difference between the areas (p > 0.05), suggesting there was little to no variation in the concentration of these metals.
Statistical analysis of the intensity counts for Hg, Pb, and As, revealed no significant fluctuations throughout the study period (p > 0.05), although the counts of all elements were higher in SLV (p > 0.05).

Figure 4. Elemental composition of seston from 26th of February to 28th of April 2021 in PUD and SLV.
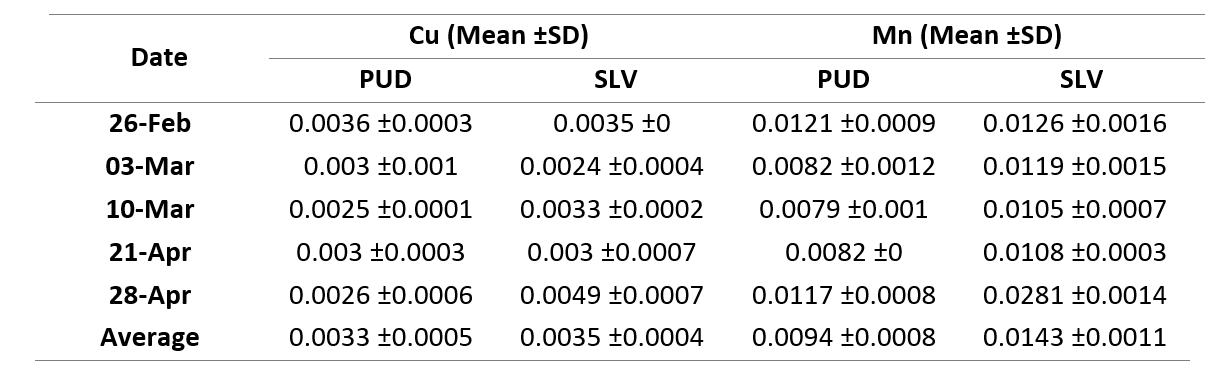
Table 1. Particulate concentration of Mn and Cu in PUD and SLV during spring 2021.
5. Discussion
5.1. Low Redfield ratios explained by natural processes and anthropogenic P input
In spring 2021, in both study sites, a diatom bloom took place on the 18th of March, which also occurred during the annual spring diatom bloom in Raunefjorden, which is typically taking place shortly after the 5th of March (Howe et al., 2010; Paulino et al., 2013). Phytoplankton play a major role in the carbon cycle as primary producers (Arrigo, 2005). Other essential micronutrients for cell growth are P and N, which are available through biochemical cycling as well (Arrigo, 2005). Thus, seston concentrations of C, N, and P can be particularly informative about the trophic state of an area when inspected in relation to one another. However, the Redfield atomic ratio interpretation can differentiate depending on the location, the season, and the ecological condition (Geider & La Roche, 2002). For example, Norwegian fjords are typically described as P-limited due to the deficit of phosphorus from freshwater sources (Erga et al., 2017; Erga et al., 2012; Paasche & Erga, 1988; Sakshaug et al., 1983; Thingstad et al., 1993). All planktonic organisms contain C, N, and P, and populations of autotrophic and heterotrophic organisms will contribute to these element pools (Erga et al., 2017).
In this study, the C:N:P ratio for PUD was 53:7:1 and 53:9:1 for SLV. C, N, and P peaked around the time of the diatom bloom, suggesting that the contribution by diatoms to the concentrations of these elements was significant. Erga et al. (2017) attained a C:N:P-ratio of 66:11:1 (C:N = 6.2) on a 5 m depth in Raunefjord, but concluded that this evidence did not support any significant nutritional deficiency for N or P. On the contrary, they found that a surplus of P likely was a response to the extreme negative North Atlantic Oscillation (NAO) in 2009-2010. Additionally, they concluded that great values of C: N and C:P atomic ratios were linked to haline stratification and high chlorophyll-a concentration, whereas high N:P ratios are linked to with low phytoplankton biomass. Atomic N:P ratios of seston matter that divert from the Redfield ratio could also be attributed to the different species that may dominate the phytoplankton community (Klausmeier et al., 2004). Therefore, C:N:P ratios depend highly on the biological, physical, and chemical processes in a certain area.
Another explanation of the low C:N:P in PUD and SLV recorded in this study could be due to a P surplus. In their research, Martiny et al. (2013) stated that elemental ratios followed a latitudinal pattern due to variations in the coupling of C, N , and P cycles along the different latitudes and observed a C:N:P ratio of 78:13:1 in cold, nutrient-rich high-latitude areas. According to the hypothesis by Redfield (1934), N:P ratio below 16 assumes N-limitation (Frigstad et al., 2011; Geider & La Roche, 2002). However, as Geider & La Roche (2002) suggested, according to studies comparing marine phytoplankton elemental composition, a ratio of N:P<16 of oceanic particulate matter can imply P-rich waters, since it can range from 5 to 19 under sufficient nutrient conditions. However, more evidence is required to determine whether a low C:N:P ratio could be attributed to P-surplus due to anthropogenic nutrient input or other physical-chemical processes in these areas.
5.2. Increased silicate as the aftermath of a Skeletonema marinoi bloom
Si and Ca are fundamental components of cellular structures in many plankton taxa like coccolithophorids, foraminifera, and diatoms (Buchan et al., 2014; Howe et al., 2010; Langer, 2008). High concentrations of these elements are linked to blooms of these organisms (Buchan et al., 2014; Howe et al., 2010; Paulino et al., 2013). In April 1973, in Hardangerfjord, particulate Ca and Si values were approximately 0.18 μM and 4.5 μM (Erga et al., 2017; Price & Skei, 1975). In 2008, Raunefjorden, particulate Si concentrations corresponded well with the two distinct diatom blooms, both dominated by Skeletonema sp. (Erga et al., 2017). In late spring 2010, at Raunefjorden, Ca and Si varied between 0.099 - 6.28 μM and 0.071–3.63 μM, respectively, coinciding with the high abundance of diatom species like Chaetoceros spp., Skeletonema marinoi, and Pseudonitzschia sp. (Erga et al., 2017). In this study, a strong link between Si concentrations (0.96–4.57 μM) and Skeletonema marinoi dominated bloom was observed. Additionally, the study area is directly influenced by the freshwater input from the Møllendal River on the southeast part of the bay, which is an important source of particulate Si in the fjord (Paetzel & Schrader, 2003). Regarding particulate Ca, biogenic matter is probably the primary source, basically in the form of coccoliths. Emiliania huxleyi is one of the most common calcifying species in Norwegian coastal waters, responsible for blooms following the spring diatom bloom (Fagerbakke et al., 1994; Heimdal et al., 1994). However, it seems unlikely that E. huxleyi would be entirely responsible for the Ca concentrations (0.15-0.95 μM) observed in this study but may be also attributed to the water mixing and/or the riverine input. The results from this study for particulate K and Mg agree with results reported in previous studies at nearby fjords (Erga et al., 2017; Price & Skei, 1975).
5.3. Metal concentrations
Fe is thought to limit primary production in marine oceanic systems (Wells et al., 1995). In this study, Fe concentration ranged between Due to a handling error during the measurement process for the samples from 18th of March to 14th of April, the concentration for elements with high molar weight like Fe, Mn, Cu do not reflect their actual particulate concentration, and are thus is not reliable. That is the primary reason why maximum Fe values documented here greatly exceed the typical particulate Fe concentrations in marine seston. Typical values for fjords on the west coast of Norway range between 0.068 –0.23 μM (Price & Skei, 1975), however, in areas strongly influenced by terrigenous sources, the concentration of particulate Fe can vary between 0.04–2.8 μM (Bazzano et al., 2014). In a study performed on shelf waters of the eastern United States, concentrations of particulate Fe and Al were indirectly linked to salinity since their concentrations in runoff water can be several orders of magnitude higher than in oceanic waters (Atkinson & Stefánsson, 1969). Erga et al. (2017) concluded that the prominent iron sources in the samples from Raunefjorden 2009-2011 were Fe sequestering bacteria (Heldal et al., 1996), Fe bound to phytoplankton cells, as well as Fe fractions associated with certain microalgae blooms. All these factors could explain the Fe values observed in this study, together with some other exogenous sources from contamination in the study area; however, this is subject to further research.
So far, no comprehensive studies have been performed on the particulate concentration of heavy metals in the study area. Most of the studies focus on analyzing the sediment and providing estimates of the pollution state based on these values. Comparison of results from sediment surveys in the entire PUD between 1992 and 2020 (Table 2) shows a remarkable decrease in the sediment concentration of most heavy metals in PUD, especially after covering the seabed in 2018 (Bergen_Kommune, 2020). In this study, I showed that heavy metal presence (Hg, Pb, As) was significantly different in the two sites (p < 0.05) with PUD having the lowest amount. It is highly possible that the low particulate concentration documented in this study is linked to their concentration in the sediment. A recent follow-up survey in PUD, however, revealed that despite the low level of pollution achieved, the top layer of the seabed is subject to recontamination with environmental toxins from the surrounding urban environment (Bergen_Kommune, 2020). This highlights that proper control of pollution sources that can lead to recontamination is the prerequisite for a monitoring plan to be successful.
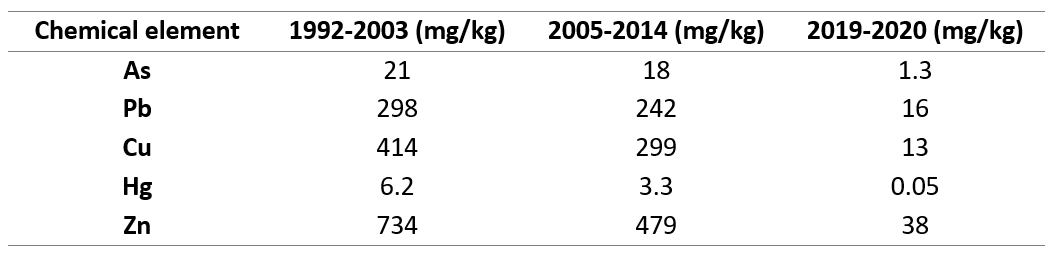
Table 2. Sediment data used in the risk assessment for PUD divided into three periods. Data from 1992-2003 and 2005-2014 illustrate the condition in the whole fjord, and it is uncertain on which depth and exact sites they were collected. Data from 2019-2020 were taken from the top 10 cm of the seabed in the most inner part of PUD(Bergen_Kommune, 2020).
6. Conclusions
This study was an effort to document the particulate concentration of chemical elements and associate these concentrations with the phytoplankton biomass. Chlorophyll-a varied with the concentration of C, N, P, and Si. These elements are important for the development of phytoplankton, especially Si for the development of diatoms that dominated during the spring bloom. Heavy metals were detected in both areas in low levels; however, the concentrations were lower in PUD, suggesting that the municipality’s plan to cover the polluted sediment may have resulted in fewer particles in the water column containing those metals. Overall, this study was an example of investigating abiotic and biotic relationships in an urban coastal environment, however, the collection of more observational data is necessary to understand the aftermath of heavy metal pollution and to design effective and sustainable management plans in the long term.
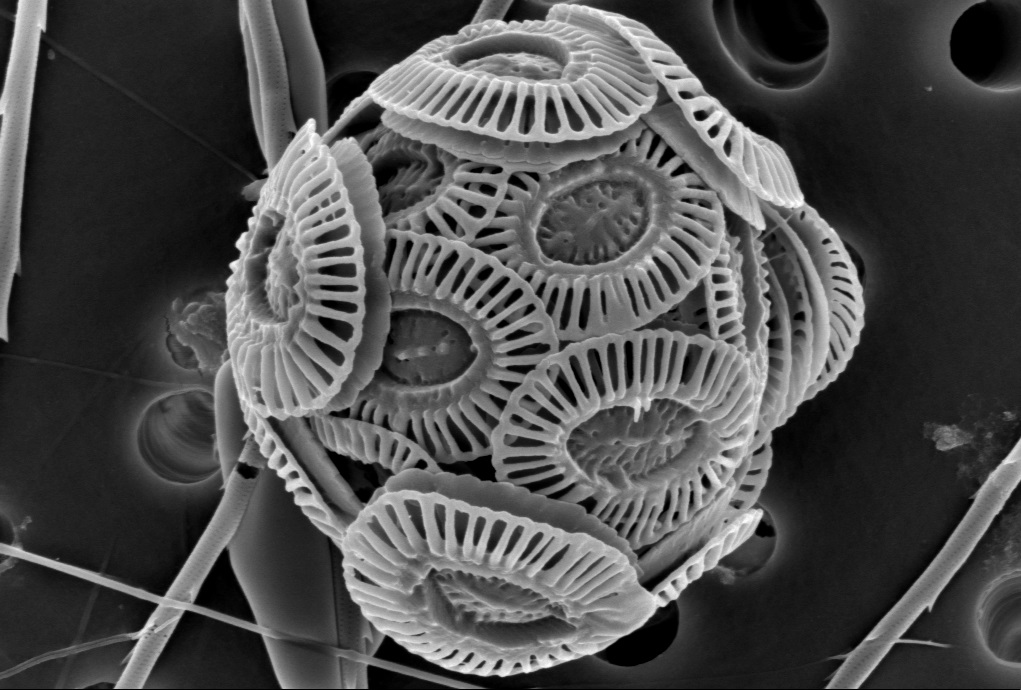
Emiliania huxleyi. Credits: ELMIlab UiB, I. Heggstad & J. Egge
About the author
 My name is Iliana-Vasiliki Ntinou, I am 24 years old and I am finishing my master’s degree in Marine Biology at the University of Bergen. My research interests include marine microbial organisms like phytoplankton and their ecological role in the changing marine environment. I am currently working on my thesis about the variation in the elemental composition of particulate matter and the microbial community in the Northern Barents Sea which is part of the Arven etter Nansen research program.
The current study was a part of the course BIO299 Research Practice in Biology at UiB during the spring semester of 2021, where we studied the elemental composition of particulate matter and phytoplankton biomass in Store Lungegårdsvannet and Puddefjoren together with my supervisors, professor Jorun Egge and researcher Tatiana Tsagaraki. I was very excited and intrigued when we discussed the opportunity to get a better look at the coastal environment of Bergen, not only because it falls into my scientific interests but also because it is directly linked to our society as most residents are concerned about the water quality of their city. You are very welcome to read my blog “Dark waters in Bergen” to find out more about the background story of the area.